Dashboard Page#
The FlexiVision One interface is organised in functional sections that guide the user from initial configuration to operational management of the system. Each page provides real-time information on machine status, connections, performance and process parameters, with direct access to the main functions. Navigation is designed to be easy to use, having immediate control over operations and continuous monitoring of vision, feeding and robot performance.
# |
Description |
|---|---|
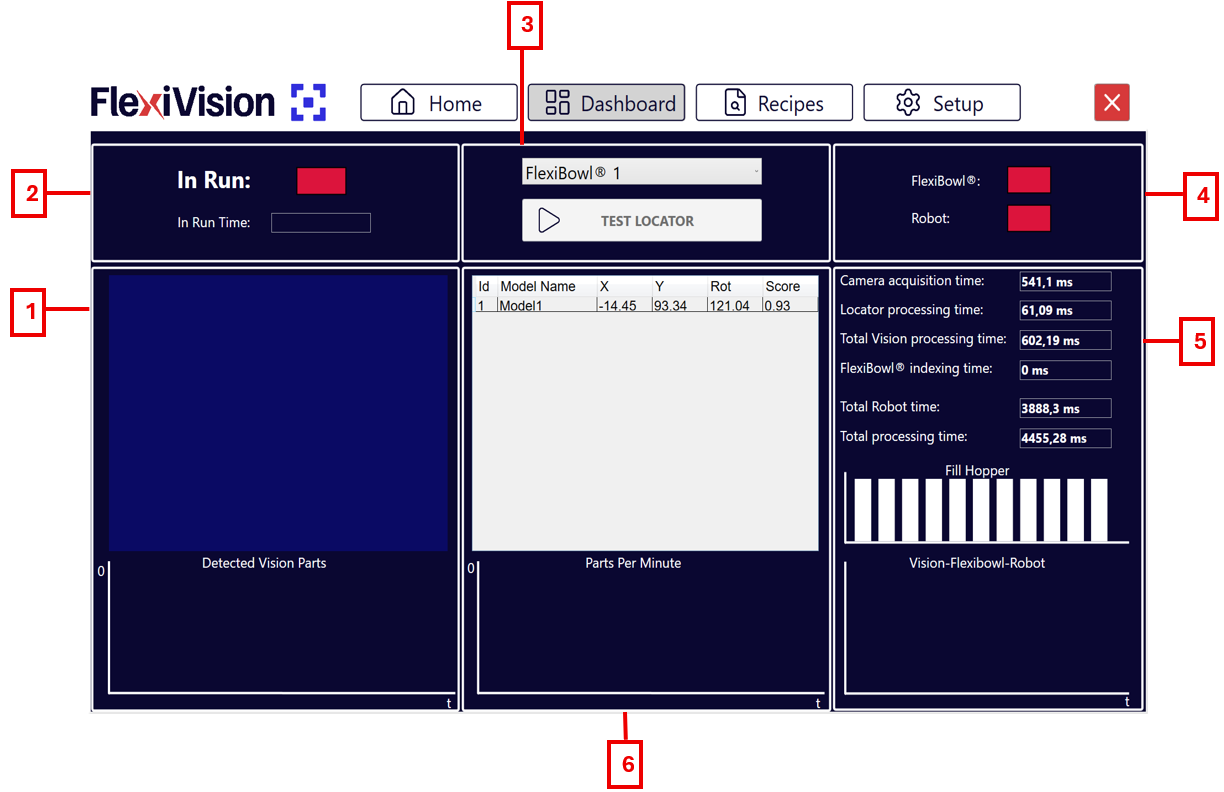
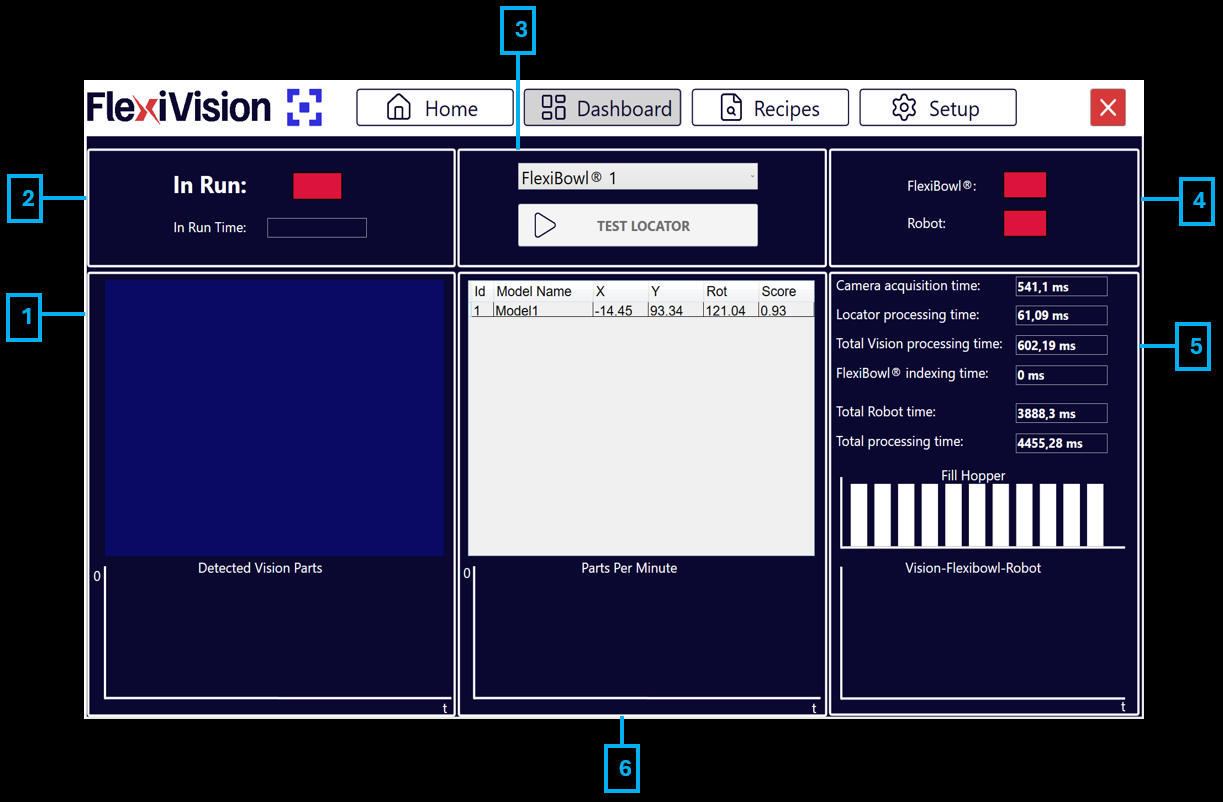
1 |
Vision and Detection Area
|
2 |
Operating Status
|
3 |
Controls and Selection
|
4 |
Connection Status
|
5 |
Timings Analysis
|
6 |
Performance Graphs and Log
|