Application Monitoring: Dashboard#
The Dashboard is the main interface for real-time monitoring of the FlexiVision One system. On this page you can check process efficiency, analyse cycle times, validate component identification and identify any bottlenecks in the system.
Interface Overview#
The Dashboard interface is divided into four main sections:
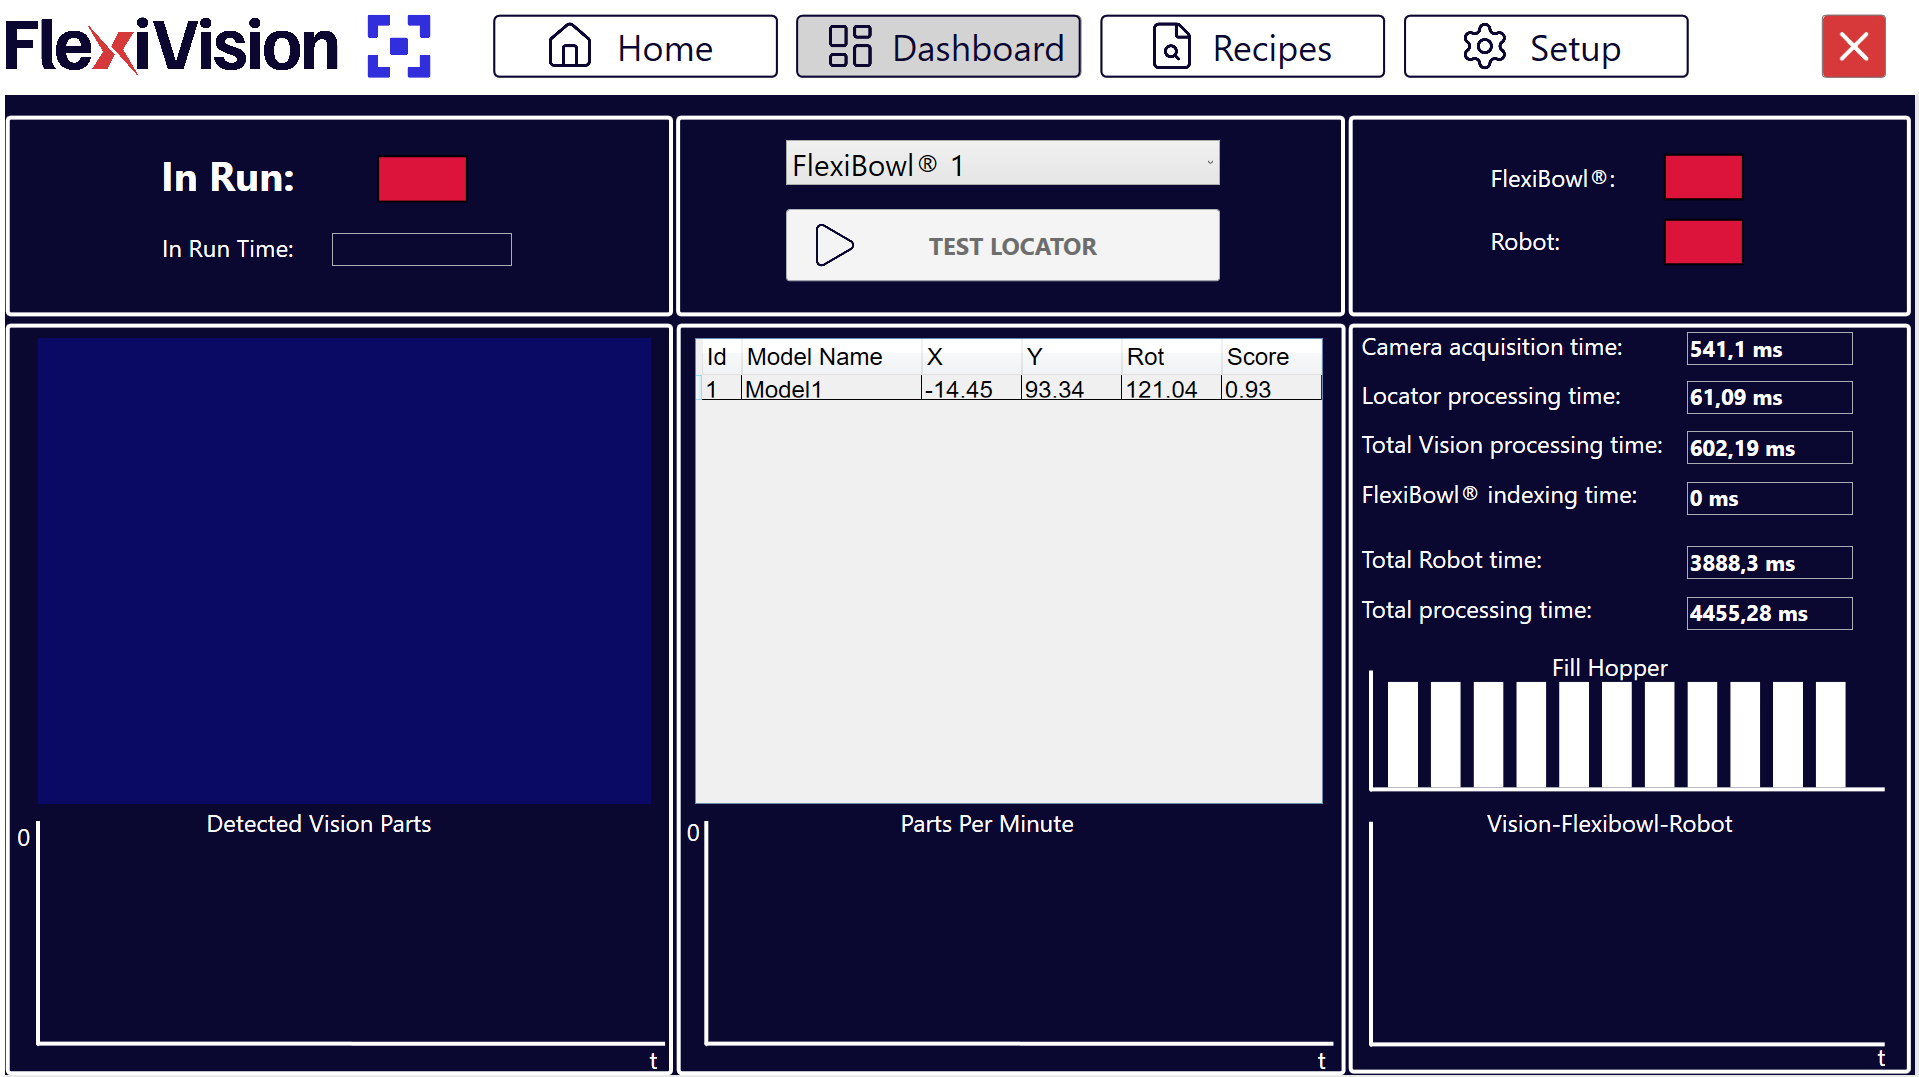
Operational Control: Execution commands and status
Vision Analysis: Display of detected parts and details
Performance Indicators: Connectivity and cycle times
Graphical Analysis: Productivity and time log charts
Operational Control - Commands and execution status#
Element |
Description and Function |
|---|---|
In Run |
Status indicator showing whether the system is currently running. |
In Run Time |
This displays the total system uptime since application start-up. |
FlexiBowl® selection |
Drop-down menu to select the specific FlexiBowl® to be monitored. |
Test Locator |
It takes a picture of the vision area and starts the identification of the components present. |
Tip
Test Locator Useful to:
Verify that the components are actually identified by the vision system
If there is a collision between robot and component and I want to check the reliability of the clearances
Vision Analysis#
The data for the components identified by the vision system are displayed in the centre of the dashboard.
Detected Vision Parts#
Detected Vision Parts shows:
Image captured in real time by the camera
A log chart of detections over the last 30 seconds showing the trend in the number of parts identified per capture.
Detected Models Table#
Detail of identified components
The table below the image lists all components in the pick area with the following parameters:
Field |
Data Type |
Description |
|---|---|---|
Id |
Integer |
Progressive unambiguous component identifier (0, 1, 2, …). Id 0 = component with the highest score (best match to the model if sorted with Score Descending as recommended). |
X |
Millimetres |
X coordinate of the component. |
Y |
Millimetres |
Y coordinate of the component. |
Rot (Rotation) |
Degrees |
Angle of rotation of the component. |
Score |
Percentage |
Percentage value (0.00-1.00 or 0%-100%) expressing the degree of identification reliability. It represents closeness/fidelity to the reference model. Higher score = better match. |
Score > 0.90 (90%): |
|
Score 0.80-0.90 (80-90%): |
|
Score 0.70-0.80 (70-80%): |
|
Score < 0.70 (< 70%): |
|
State and Performance Indicators#
Connectivity#
Communication with external devices status indicators:
Indicator |
Description |
|---|---|
FlexiBowl® |
Status of the hardware connection between the VisionController (PC) and FlexiBowl®. |
Robot |
Status of communication with the robot. |
Warning
Actions in case of disconnection
FlexiBowl® red:
Check Ethernet cable FlexiBowl® → VisionController
Check FlexiBowl® power supply
Check FlexiBowl® IP in FlexiBowl® Setup
Try reconnect or software reboot
Robot red:
Check Ethernet cable Robot → VisionController
Check that robot has open TCP/IP connection
Check TCP/IP port in Robot Setup
Check robot program (IP address of VisionController and Port inserted correctly in robot setup section )
In production, both indicators must always be green.
Time Analysis#
The system provides a detailed breakdown of cycle times to identify possible bottlenecks and optimise the process.
Time Entry |
Description |
|---|---|
Camera Processing Time |
Time taken to capture the image from the camera sensor. This includes exposure time and data transfer. |
Locator Processing Time |
Time required by the vision algorithm to locate and identify components in the captured image. It depends on: number of active models, complexity of models, number of clearances. |
Total Vision Processing |
Sum of Camera and Locator times. It represents the total time it takes for the vision system to process an image and send the co-ordinate(s). |
Total FlexiBowl® Time |
Time taken by the FlexiBowl® to perform a complete handling sequence. |
Total Robot Time |
Estimated or detected time for the complete Pick & Place operation of the robot. It includes: approach → pick → place → return. |
Total Processing Time |
Total time of complete cycle (Vision + FlexiBowl® + Robot). It represents the time from the start of one cycle to the start of the next one. It determines the theoretical maximum productivity (PPM). |
Tip
Time interpretation for optimisation
The time chart allows the bottleneck of the system to be identified:
If Total Vision Processing is the highest:
Too many active models → Disable unnecessary models
Models too complex → Simplify with higher Score Threshold
Too many clearances → Reduce number or size of clearances
Camera Processing high → Reduce exposure time
If Total FlexiBowl® Time is the highest:
Too many pauses → Optimise Flip/Move synchronisation and reduce stabilisation pause (Pause X ms)
Movement sequence too slow → Increase speed in Config FlexiBowl®
Excessive rotation angle → Reduce Move Angle
Shake too long → Increase SHAKE speed and reduce SHAKE cycles
If Total Robot Time is the highest:
Robot path not optimised → Optimise robot path planning
Robot speed too low → Increase movement speed (if safe)
Place distance too long → Reposition place point closer
Pick times too long → Optimise gripper opening/closing
Optimisation target: Balance the three times to reduce overall Total Processing Time.
Graphical Analysis#
The charts at the bottom of the dashboard provide a predictive and diagnostic analysis of system performance over time.
1. Parts Per Minute (PPM)#
Productivity chart |
Shows the average productivity of the system expressed in components picked per minute (Parts Per Minute). |
Features: |
|
Use: |
|
Tip
Constant and stable PPM: |
✓ System configured properly |
PPM progressively decreasing: |
⚠️ Possible component wear (FlexiBowl® grip surface) |
PPM with large fluctuations: |
⚠️ Instability in the process |
Corrective actions: |
|
2. Fill Hopper#
Hopper activation chart |
Represents the log of the unloading pulses sent to the hopper. |
Features: |
|
Use: |
|
Tip
Regular and constant activations: |
✓ Optimal Hopper Configuration |
Ever more frequent activations: |
⚠️ Hopper is emptying (fewer parts = more activations to maintain level) |
No activation for a long time: |
⚠️ Robot stopped or slowed down (parts not consumed) |
Very close activations (bursts): |
⚠️ Hopper threshold not configured properly (too high) |
3. Vision - FlexiBowl® - Robot (Comparative Chart)#
Overlapping time chart |
A three-line comparison graph that overlaps the timing of individual processes over time. |
Use: |
|
Quality Monitoring - Critical Indicators to be monitored#
Component Score |
Make sure that the Score of the detected components is constantly above the tolerance threshold (Accept Threshold) set during model configuration. |
Score Monitoring: |
|
Gradually decreasing scores: |
⚠️ Real parts different from training (production variations) |
Corrective Actions: |
|
Production Monitoring Best Practices#
Daily checks#
At the start of production (5 minutes): |
|
During production (check every 1-2 hours): |
|
At end of shift (2 minutes): |
|
This minimum routine ensures quick identification of problems and maintains performance traceability.
Performance report#
Tip
Key metrics to be tracked To evaluate performance over time, track:
Daily: |
|
Weekly: |
|
Monthly: |
|
This data enables continuous optimisation and justifies investment in improvements.